Traces
Visualization for tracing sub-system of Haystack.
Traces Search
Any query done in the search bar will display the traces tab. Using the search bar, fields you want to filter on can be specified key=value format. Time Picker allows selecting presets and any time range you want. For more information on universal search bar querying, visit the Universal Search documentation.
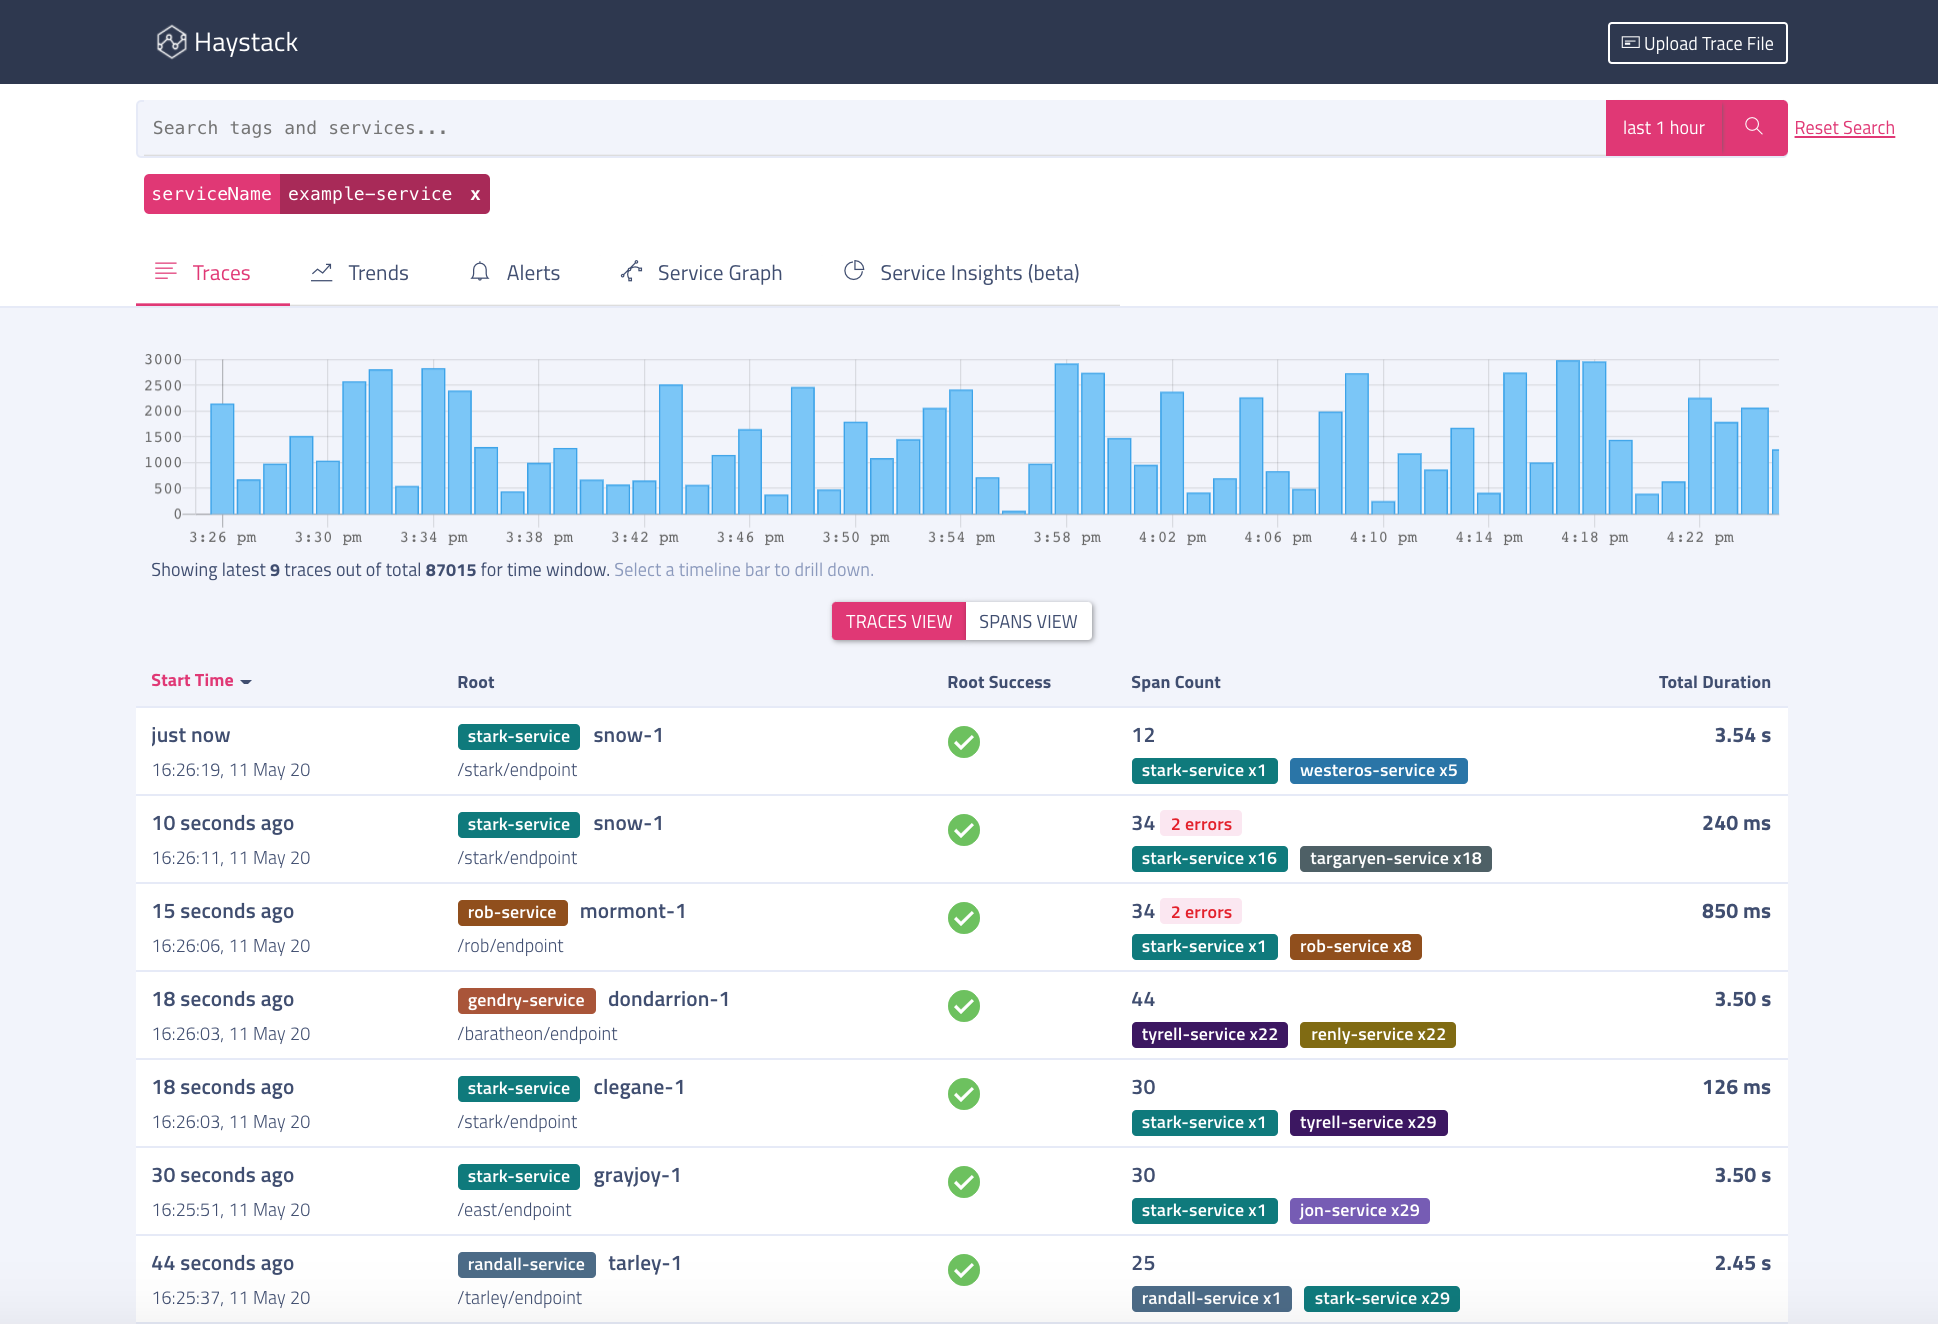
Search results are presented in tabluar format for easy visualization of the data. All the columns are sortable. Here are details about how each column in search results is calculated -
- Start Time - Start time of the first span in local timezone.
- Root - Operation name of the root span, root span(aka. loopback span) is the first span where user request started. Second line provides the URL(from span.tags.url in trace).
- Success - Status of trace. Is marked failure if any spans in trace have success marked as false.
- Spans - Total number of spans across all services in the trace. Second line shows upto top two services based on count in the trace.
- Op Duration - Total duration for the queried operation. Sum of duration of all spans of the queried operation.
- Op Duration % - Percentage of total duration for the queried operation as compared to duration of the trace. Could be > 100% if there are parallel calls.
- Svc Duration - Total duration for the queried service. Sum of duration of all spans of the queried service
- Svc Duration % - Percentage of total duration for the queried service as compared to duration of the trace. Could be > 100% if there are parallel calls.
- Total Duration - Duration of the span. It is the difference between the start time of earliest operation and the end time of last operation in the trace
Trace Details
Along with Timeline representation of a trace, haystack comes with 4 more sub-views for providing different prospectives on a trace.
Timeline
Waterfall for the trace, it shows span timelines using horizontal bars and parent child relationship between them using dotted lines.
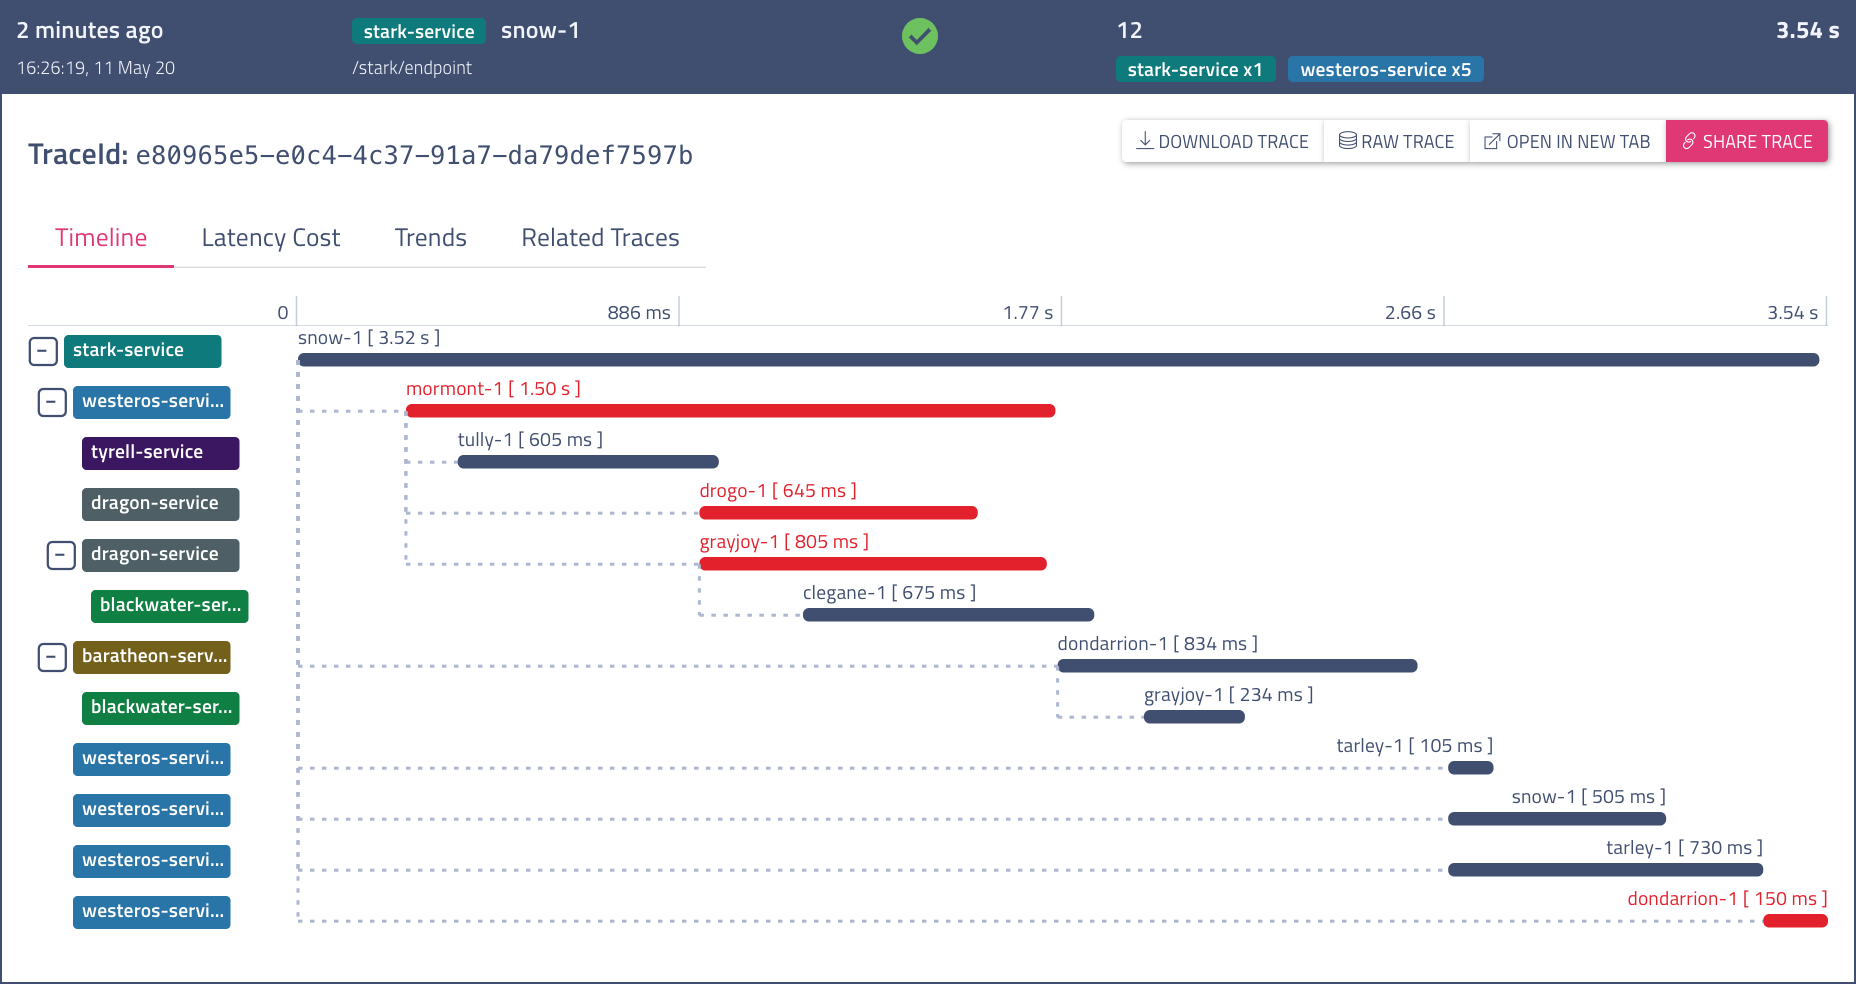
You can see more details about an individual span like Logs and Tags for that span and raw spans by clicking on the span. Also, clicking on Share Trace copies a sharable persistent link for the trace.
Latency Cost
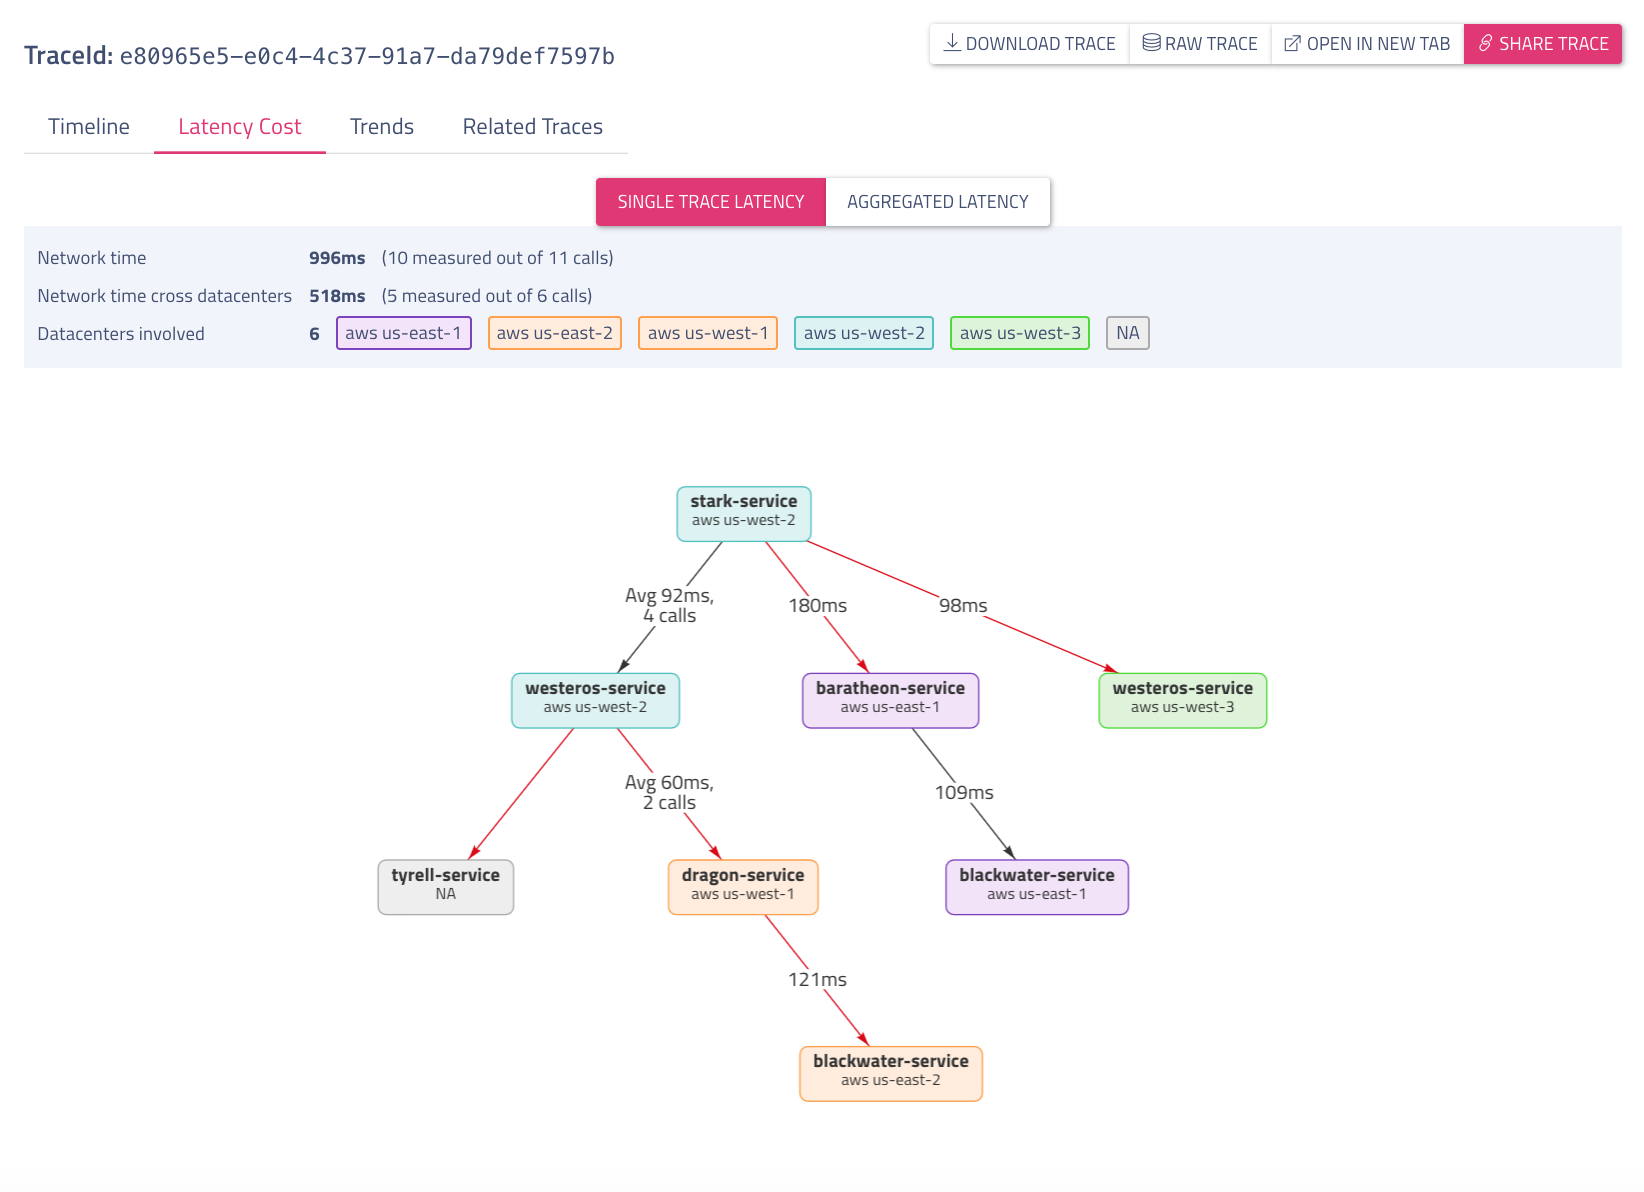
Latency cost view is a handy tool to analyze how much time a trace is consuming in network and if it there are cross datacenter calls involved. Nodes in this call graph represent a service in a datacenter. Edges represent network calls, edge value is network latency for the call(or average network latency if there were multiple calls between services). Red edges mark cross region network calls.
Trends
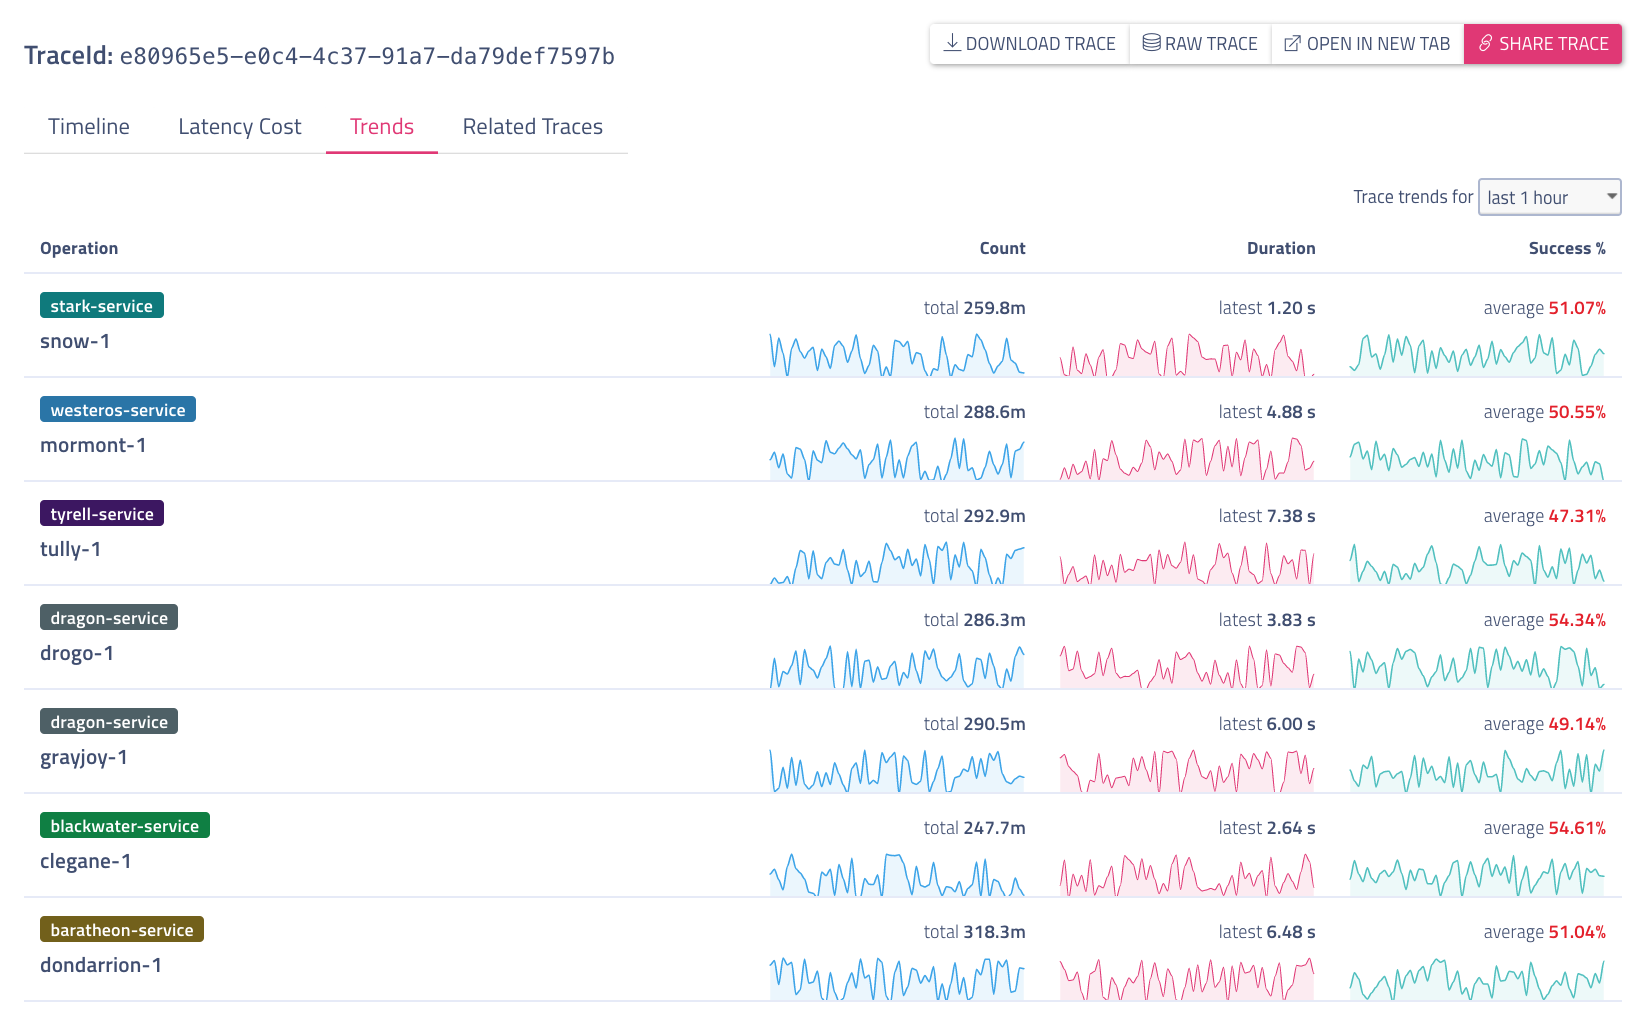
Trace-Trends view is simply a list of all operations involved in a single trace along with their current count, duration & success trends. One quickly compare involved trends and spot if any of these trends have changed recently causing issue with the trace.
RelatedTraces
Related Traces view aggregate traces across services that are correlated to the current trace by tag value. It provides an intuitive and quick way to find traces that are similar to the current trace.
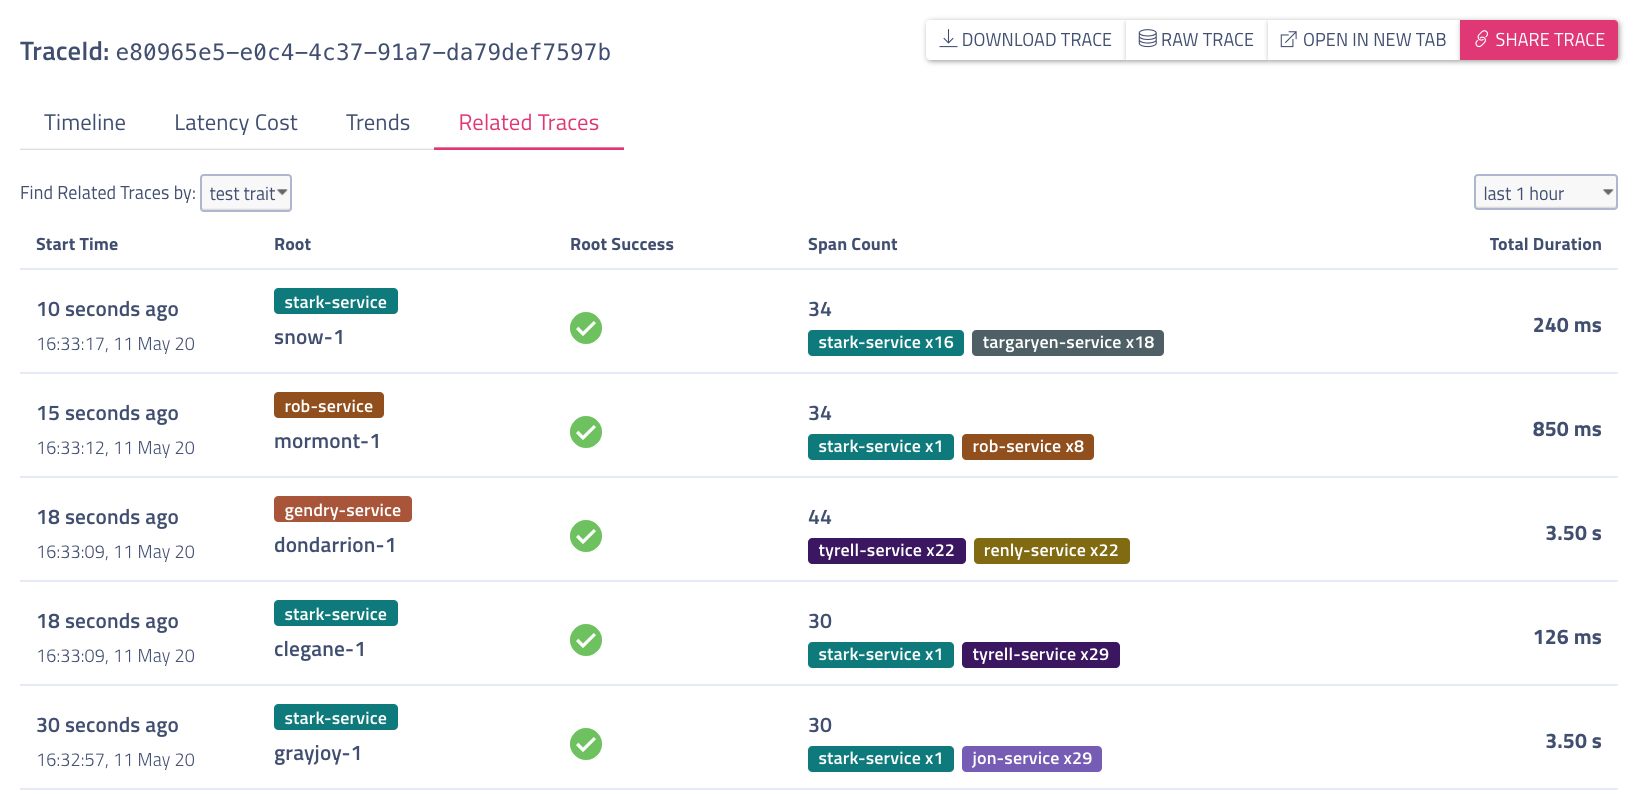
To see this view, you must configure it through the relatedTracesOptions property of your base.js configuraton file. Here's a full sample configuration, with all possible (and required) fields in each option/object of the array:
relatedTracesOptions: [
    {
        fieldTag: 'url2',
        propertyToMatch: 'url',
        fieldDescription: 'test trait 1'
    },
    {
        fieldTag: 'url2',
        propertyToMatch: 'url2',
        fieldDescription: 'test trait 2'
    }
]
The Related Traces view finds related traces by extracting the value of the propertyToMatch of the current trace and then querying traces with a key value pair where the key is the fieldTag and the value is the former value. The fieldDescription is the description of this relation that will appear in the "Find Related Traces by" dropdown in the related traces view. Note: the fieldTag must be indexed to elasticSearch, i.e. included in the whitelist.json file in the haystack-indexer. This configuration makes mixing and matching properties more easy and flexible.
In the example configuration above, when the first option is chosen in the dropdown, the view will extract the value of url of the current trace and then search for traces where url2 equals that value.
