Trends
The Trends subsystem is responsible for reading spans and generating vital service health trends.
Haystack collects trace data from services, creates a distributed call graph from that data, and depicts the time taken by calls across various services. By identifying the trends of change in the call pattern or the time taken to complete calls, Haystack makes it easier to identify which part of a complex system is responsible for a change in the system's responsiveness.
What we Trend
We currently compute four trends for each combination of service and operation contained in the span pushed to Haystack.
- total_count
[count] - success_count
[count] - failure_count
[count] - duration
[mean, median, std-dev, 99 percentile, 95 percentile]
Each trend is computed for 4 intervals [1min, 5min, 15min, 1hour].
Architecture
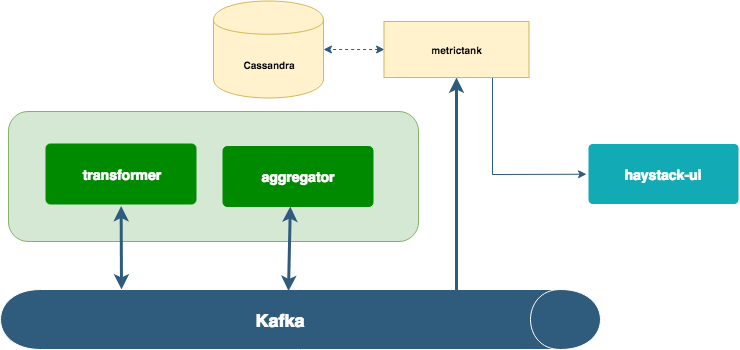
The Trends service is a loosely coupled system that uses Kafka as its backbone. It is a collection of modules which reads spans and pushes aggregated metric points to Kafka. Each module runs as an individual app, and the apps talk to each other via Kafka.
haystack-span-timeseries-transformer - This app is responsible for reading spans, converting them to metric points and pushing raw metric points to Kafka, partitioned by metric-key.
haystack-timeseries-aggregator - This app is responsible for reading metric points, aggregating them based on rules and pushing the aggregated metric points to Kafka.
The time series metric points are MetricTank compliant and can be directly consumed by MetricTank.
Extensions
Trends - Other than the four default trends more trends can be computed by adding a transformer to create the metric point and adding an aggregation-rule for it.
TimeSeries Database - Haystack supports MetricTank as its time series store by default. If you use another time series database, you can write another adapter for that database, and configure Trends to use it.
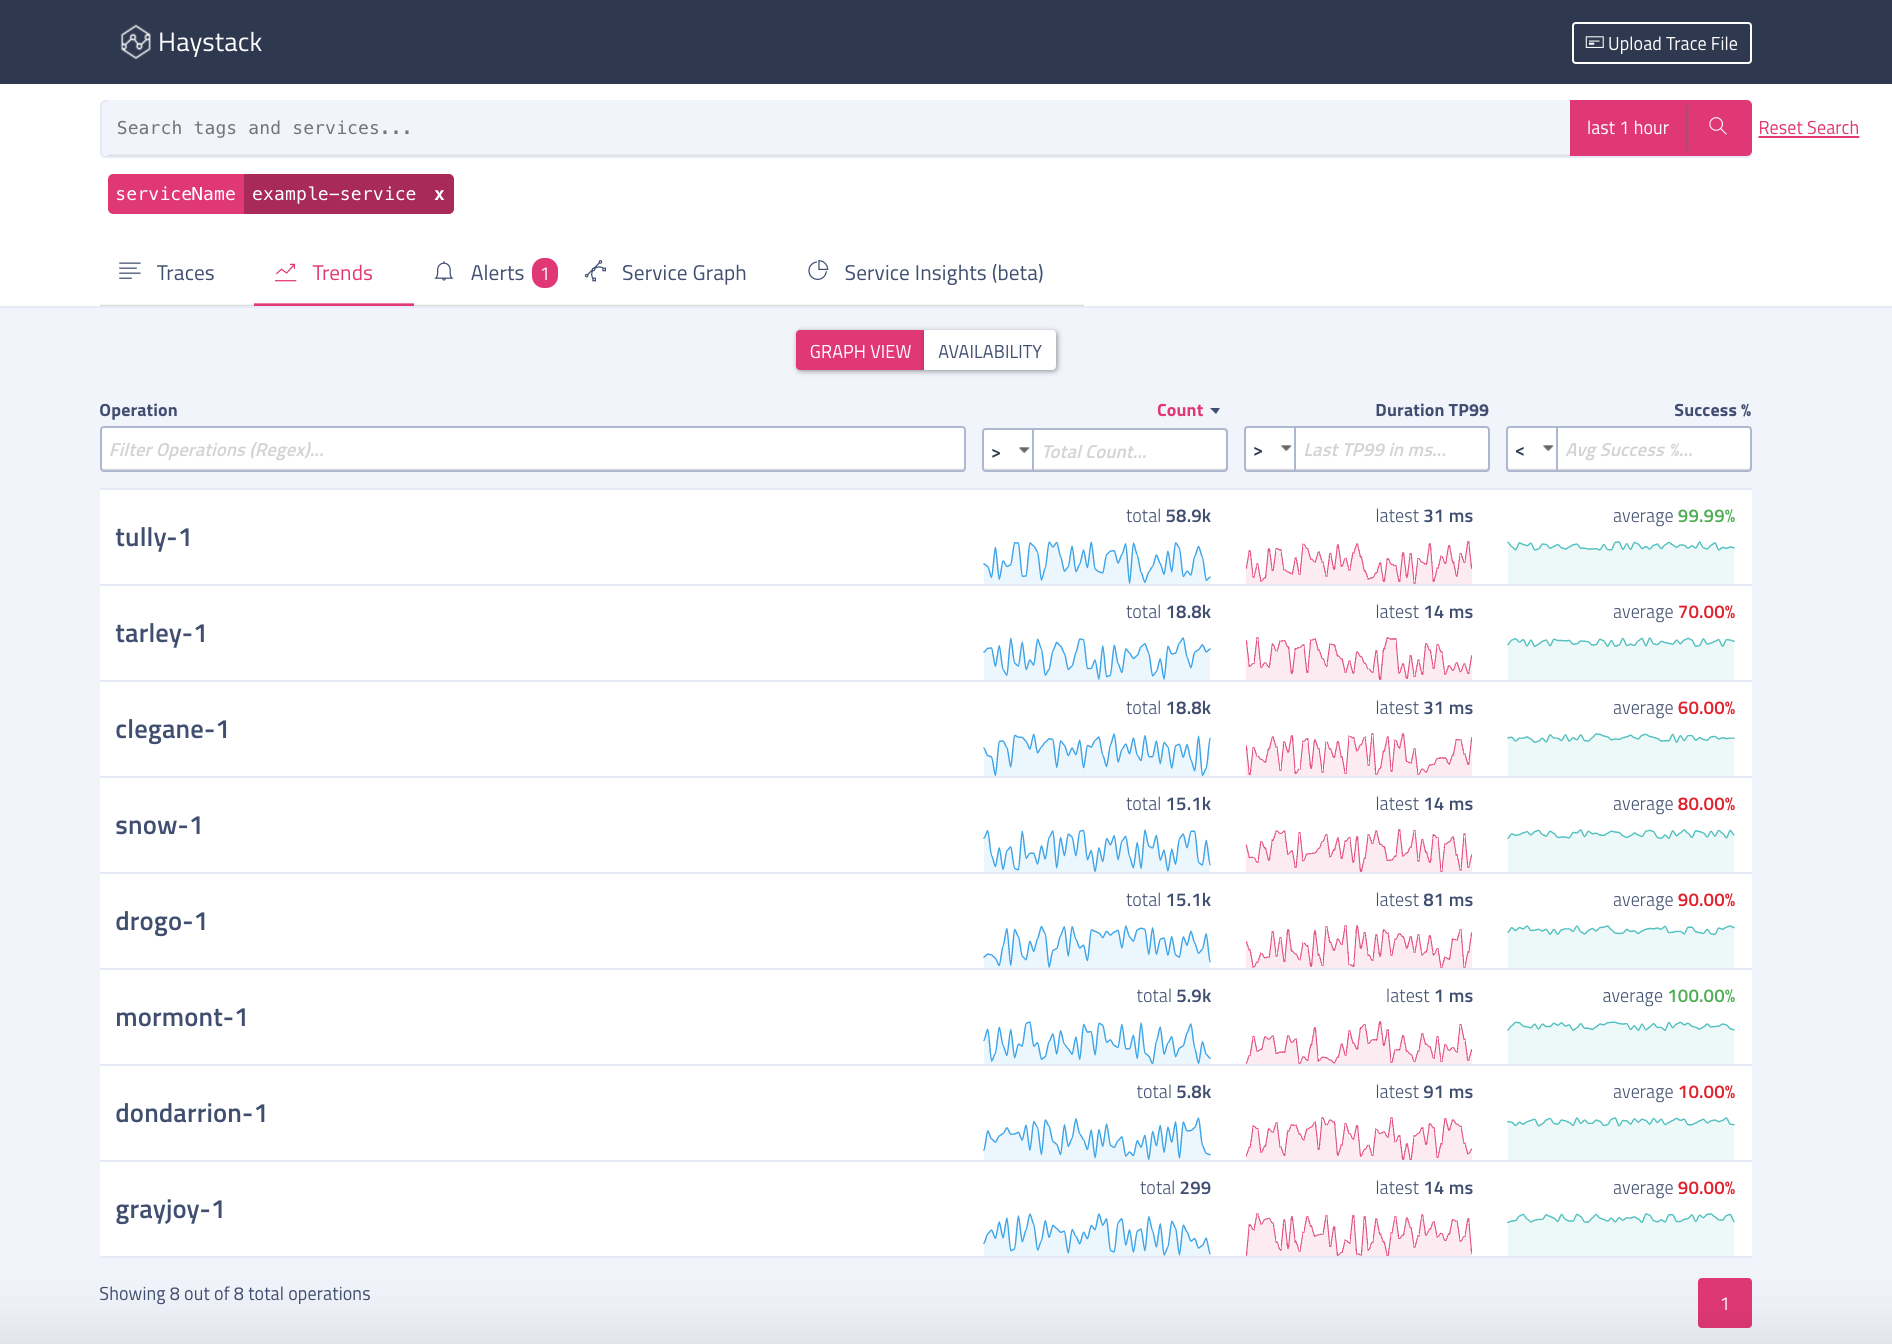
The Trends system maintains trend information and provides it for subsequent display to users in the Trends UI and analysis by automation like the Anomaly Detection subsystem.