Service Graph UI
Visualization for Haystack's Service Graph submodule. Haystack's Service Graph UI utilizes Netflix's open-sourced data visualization tool, Vizceral.
Default View
Upon landing on the home page with service graph enabled and no query submitted to the universal search bar, the service graph will list display information about the services in the service graph submodule for the selected time period (default 1 hour).
Hovering over a service name will display traffic information (requests/sec and error rate) at a quick glance. The color of the service nodes will represent the health state, and a traffic animation will display the calls between nodes.
Please note: the traffic animation is for visualisation purposes and shows traffic compared to other nodes, and does not accurately display requests/sec or the duration of the request.
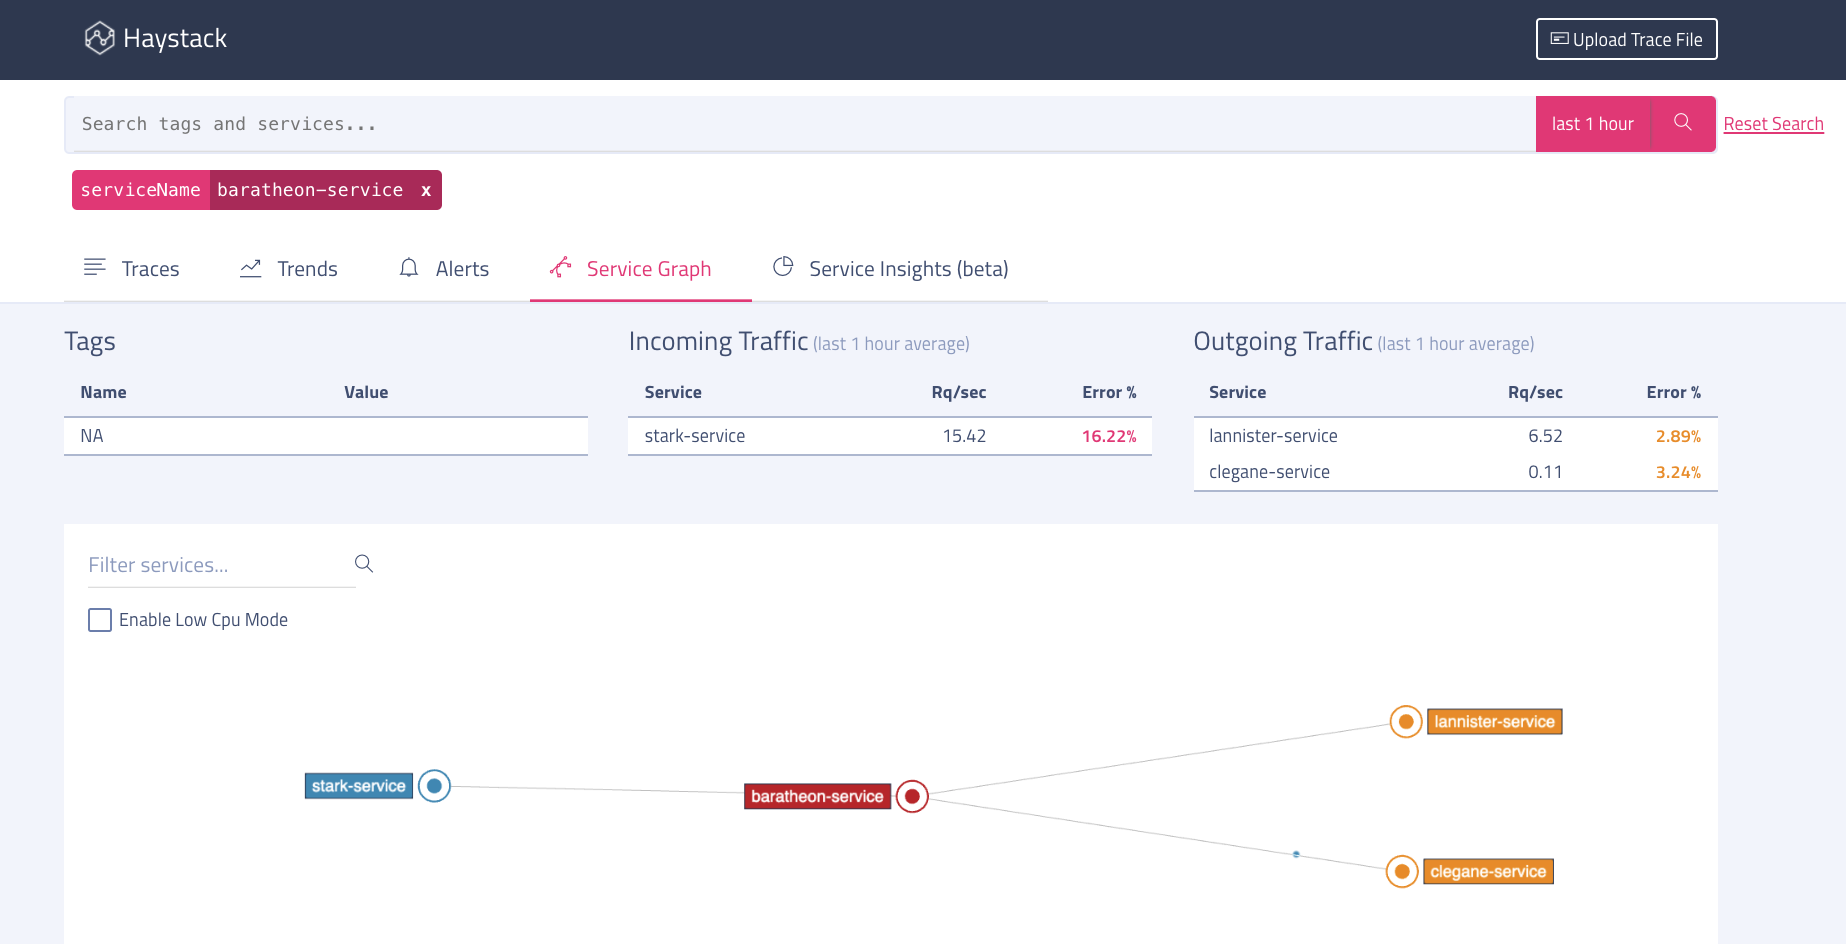
Detailed View
Upon selecting a service, you will be taken to a detailed view, showing only the upstream and downstream services. Additionally, any supplied tags and traffic information about incoming and outgoing service calls are visible at the top of the page. From here, it's easy to hone into a specific time window or link off to view traces and trends for the selected service.