Service Insights UI
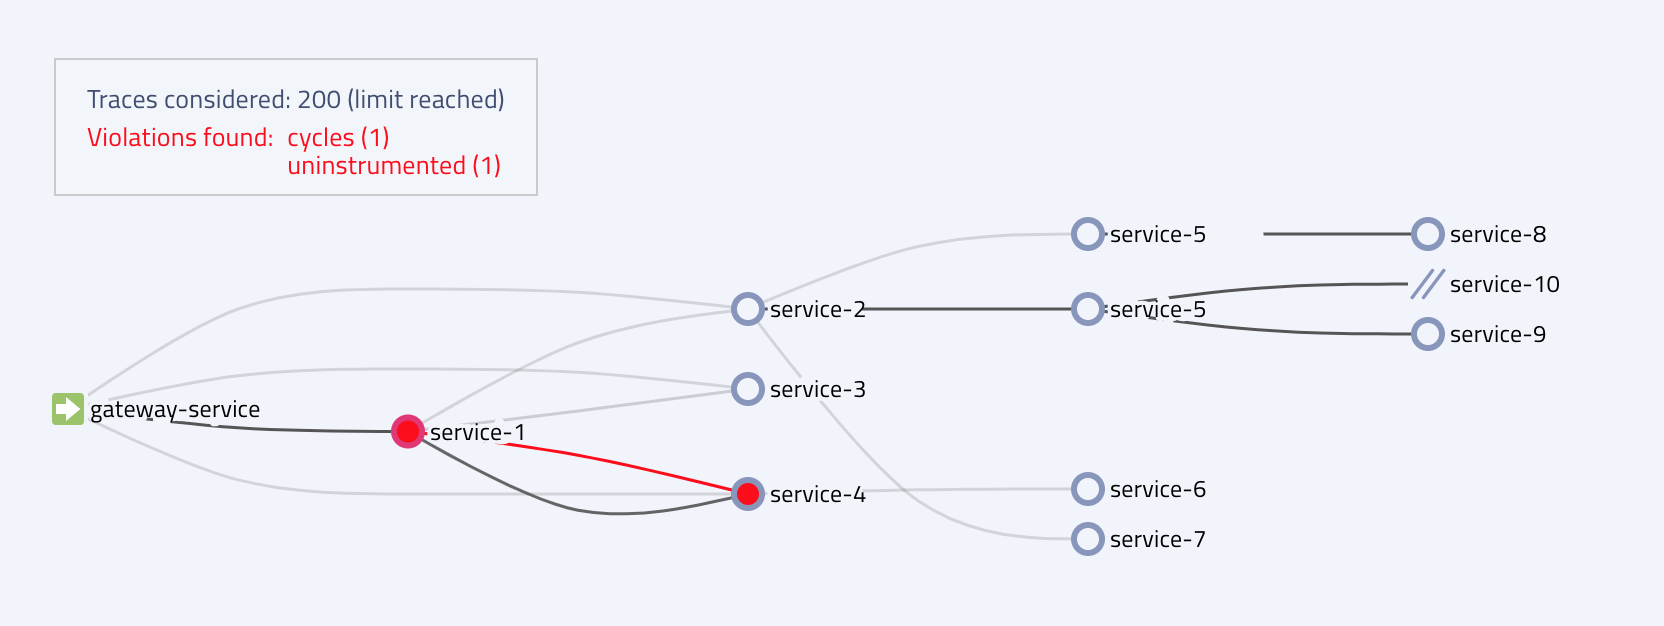
Visualization for Haystack's Service Insights submodule, which provides an alternative service dependency view from the service graph subsystem.
How to Use
Service insights works by leveraging the tracing backend to query traces. If supplying a serviceName or operationName, service insights will query a high number of traces to formulate a detailed dependency graph from the retrieved spans. The max number of queried traces is customizable so as to not overload the backend. If supplying a traceId, insights will create a graph just on the trace supplied.

Features
Service insights provides a number of features that the service graph does not. Insights can display the type of span, whether it is a service, gateway, database, or outbound. It can also detect certain tracing violations, such as uninstrumented services or cycles.
Due to the ability to see uninstrumented spans in the graph, service insights has the ability to show some details the service graph cannot, as the service graph requires services to be properly instrumented.
Highlighting a node on the insights graph will display a the span type, trace count, average span duration, and a list of all operations found.

Service insights has a few drawbacks from the service graph view. With high-volume services, the graph view can vary from query to query as the graph takes a select sample of traces. Additionally, with very high span count traces or too many traces queried, the service insights backend can be taxing on the traces backend.
