Service Graph
Haystack-service-graph
The service graph or the dependencies subsystem is designed for visualizing service graphs and how requests are flowing between them. It will combine data from the Alerts and Trending subsystems into a dependency graph to show the current state of the system at a glance. You will be able to drill down into the graph to get details and fine-grain data.
Building the service graph
The service graph or the dependencies subsystem uses the parent-child relationships of spans to create the dependency graph. Each partial span pair (one server span and one client span) represents a call over the network. In a Kafka stream app, we will generate graph edges by buffering partial spans and emitting dependency graph edges when the span pair is complete. The collection of all edges forms the global dependency graph. The graph will be persisted in a Cassandra table as a time series, and consumed by the Dependencies UI.
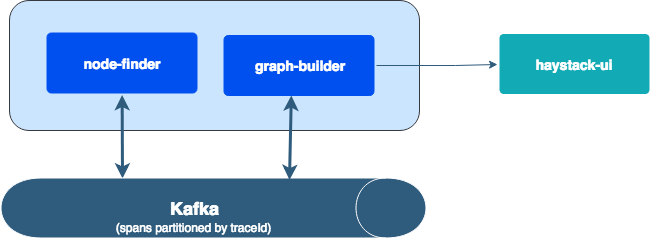
This repository has two components that focus on:
- Building a service dependency graph from incoming spans and
- Computing the network latency between the services that allows haystack-trends to produce latency trends between services
Component: node-finder
This component discovers the relationship between services. Services are the nodes in the graph with operations being the edges. Since individual spans (client or server spans) do not carry the name of the services being called or calling them, this component accumulates the incoming spans and uses span-id to discover the dependent services and the operations between them.
Discovered "span pairs" are then used to produce two different outputs
- A simple object that has calling service name, called service name and the operation name and
- A
MetricPointobject withlatencybetween the service pair discovered
Like many other components of Haystack, this component is also a Kafka streams. Picture below shows the topology / architecture of this component
Starting point for the application is the Streams class. This class builds the topology shown in the picture above.
node-finder topology consists of one source, three processors and two sinks.
Source: Topology contains a source called
proto-spans. This source reads a kafka topic with the same name. It usesSpanDeserializeras value deserializer to read incoming spans in the topicProcessors:
span-accumulator : This processor accumulates all the incoming spans in a PriorityQueue ordered by Span's timestamp to maintain the incoming order. Periodically, it traverses the priority queue to find spans with matching span-ids and combines them to form a client-server span pair. These span pairs are then forwarded to the downstream processors. Accumulation time is configurable with a configuration keyed by
accumulator.interval. It has a minor opimization built in during queue traversal to match recently arrived spans with the spans in next batchlatency-producer : Latency producer is one of the processors downstream of span-accumulator. This is a real simple processor that produces a simple
MetricPointinstance to record the network latency in the current span pair. A sample JSON representation of the metric point will look like
{ "metric": "latency", "type": "gauge", "value": 40.0, "epochTimeInSeconds": 1523637898, "tags" : { "serviceName": "foo-service", "operationName": "bar" } }- nodes-n-edges-producer: This processor is another simple processor that is downstream of span-accumulator. For every span pair received, this processor emits a simple json representation of a graph edge as shown below
{
  "source": "foo-service",
  "destination": "baz-service",
  "operation": "bar"
}
Sinks:
metric-sink: This sink is downstream of latency-producer. It serializes MetricPoint instance with a
Message Packserializer writes to a configured Kafka topicgraph-nodes-sink: This sink is downstream of nodes-n-edges-producer. It serializes the JSON as a string and writes it to a configured Kafka topic for
graph-buildercomponent to consume and build a service dependency graph
Component: graph-builder
This components takes graph edges emitted by node-finder and merges them together to form the full service-graph. It has a dual function as an http endpoint to return the accumulated service-graph.
Streaming
graph-builder accumulates incoming edges in ktable, using the stream table duality concept. Each row in ktable represets one graph edge. Each edge is supplemented with some stats such as running count and last seen timestamp.
Kafka does take care of persisting and replicating the graph ktable across brokers to have fault tolerance.
HTTP API
graph-builder also acts as an http api to query the graph ktable. Uses servlets over embedded jetty for implementing endpoints. Kafka interactive query is used for fetching graphs from local.
Interactive query to a single stream nodes return only the graph-edges sharded to that node, hence it is a partial view of the world. The servlet take care of fetching partial graphs from all nodes having the ktable to form full service-graphs.
Endpoints
/servicegraph: returns full service graph, includes edges from all known services. Edges include operations also.
Building
To build the components in this repository at once, one can run
make all
To build the components separately, one can check the README in the individual component folders.